Search Ads — 21 May 2024
Apple Search Ads Cost: CPT, CPA, and CR Benchmarks 2024
 Gabriel Kuriata

How can you be certain that your Apple Search Ads search results campaigns are reaching their true potential and that the costs of campaigns remain firmly under control? At SplitMetrics, we know that evaluating your Apple Search Ads performance is much easier with industry benchmarks at hand. This is why we always keep our finger on the pulse of the mobile app market, analyzing millions of app downloads, keywords, and billions of impressions. Our analysts provide regular overviews of the main Apple Search Ads metrics: TTR, CR, CPT, and CPA, along with market insights from the mobile industry leaders.
This article is an easy digest of our Apple Search Ads Search Results Benchmarks Report covering the campaign data for the entirety of 2023, ready to be implemented in your mobile app marketing activities on the App Store in 2024.
The report includes data on costs per tap (CPT), tap-through rates (TTR), costs per acquisition (CPA), and conversion rates (CR). It also offers insights into macro-trends influencing them. Additionally, we shed some light on the interesting topic of measuring cost per actual install (CPI) and discuss managing Apple Search Ads.
Below are key figures from our report describing the American market:

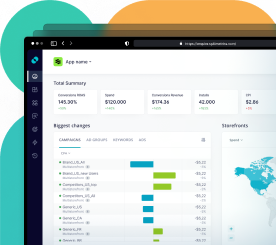
Benchmarks are a key tool for marketers to set realistic or more ambitious campaign goals. Our benchmarks come from thousands of search results campaigns run with SplitMetrics Acquire, an Apple Search Ads management & optimization platform that unites the best-performing and most successful apps available on the App Store. Take our benchmarks as guidance and set your app on a path to success. Here’s how you can access all the data that we have to offer:
We recommend using our live dashboard. It’s got the latest figures, updated in real time. Use it as an everyday reference tool for configuring your campaigns.
Check out our most recent benchmark report for a more in-depth perspective and tips & tricks from the industry’s experts.
To see how the App Store environment evolved over the years, check out our past reports on ads in search results:
In 2023, we’ve released a report for a new placement: product page ads! Learn more about them and how they can fit into your multi-placement Apple Search Ads campaigns.
To answer this mobile app marketing benchmark question and uncover average CPT, CPA, and TTR in app categories for the entire 2023, we analyzed:
To help you understand these numbers better and optimize your Apple Search Ads for the best results, we’re also sharing key factors that determine Apple Search Ads price and – what’s even more important – our tips for managing your App Store Ads cost and performance.
SplitMetrics Acquire is integrated with Apple Search Ads Advanced. This platform uses the pay-per-tap model, so let’s begin our overview with the average cost-per-tap analysis.
In 2023, the average cost per tap of Apple Search Ads amounted to $1.59 for Search results campaigns. Costs per tap for the top 15 categories are shown on the chart below:
Finance was the most expensive category, with CPT reaching $4.77, after a drop from $6.54 in H2 2022. Sports and News categories followed, with average CPTs standing at $2.43 and $2.37, respectively. Compared to the data from the second half of 2022, we can observe that traditionally expensive categories maintained their top spots despite some reshuffling.
The value of CPT (and the App Store advertising cost in general) is driven by competitive bidding, with high costs signaling high possible returns. The overall shape of the economy also has a tremendous impact on this metric, just like on CPA (cost per acquisition). The Finance app category is an excellent example of this. Although the $6.54 average CPT in H2 2022 may seem high, it pales compared to the $11.73 it reached in 2021. That value was driven by a boom in the cryptocurrency segment. Now, obviously, these types of apps have a much-reduced impact.
Additionally, high initial costs can be eventually offset by capitalizing on the Apple Seach Ads – ASO synergy that can result in higher organic traffic and better brand recognition. Exploring other ad placements on the App Store can also contribute to connecting with users throughout the funnel, thus optimizing overall performance and costs. App marketers also optimize their strategies over time, impacting global figures.
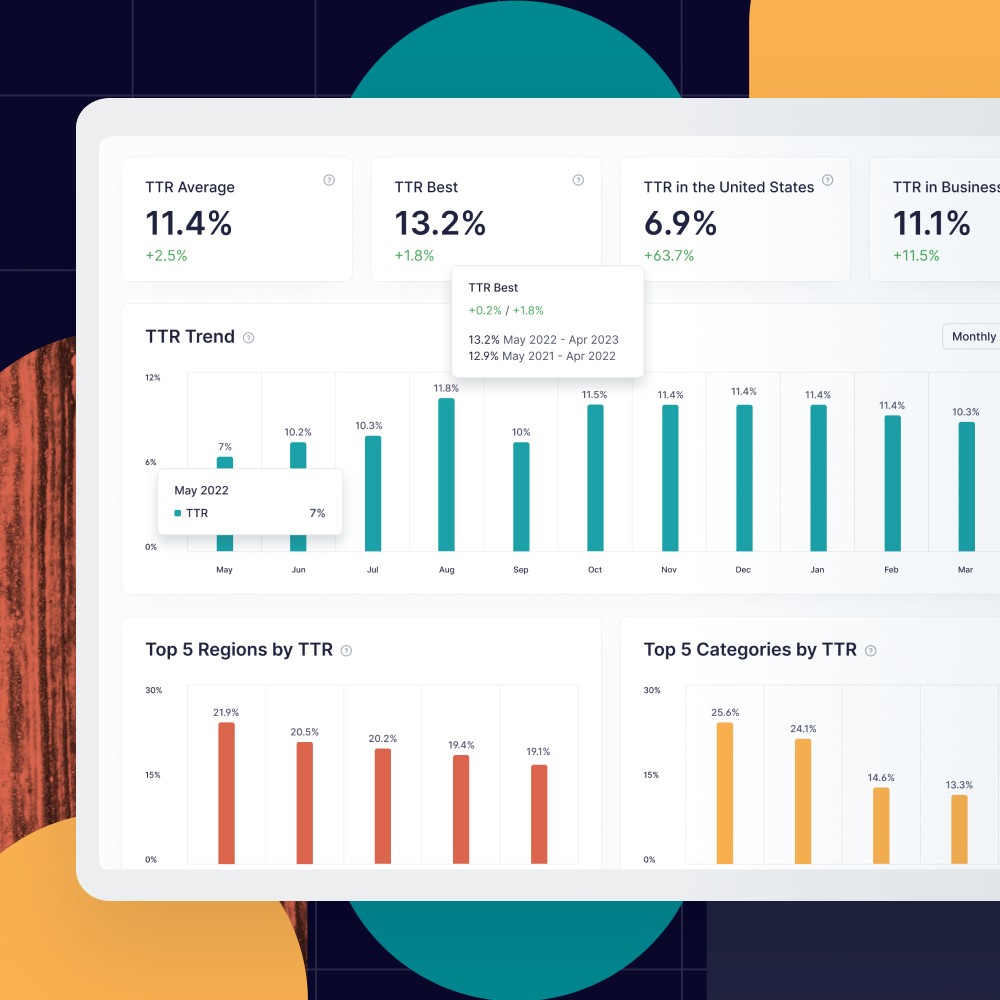
Search is the primary way users find new apps on the App Store. A high tap-through rate signifies that users find what they’re looking for. Many factors can influence TTR. For example, lifting pandemic restrictions in the past drove the Food & Drink category results. The debut of AI image-generating technology boosted TTRs of Photo & Video apps. Consistently high TTR can be driven by the presence of powerful brands in a given category – this is the case for Entertainment apps.
The average tap-through rate amounted to 10.22% in 2023. Entertainment topped the ranking for the entire year, with an outstanding 27.86% TTR, followed by Sports (20.46%), Food & Drink (12.64%), Business (12.44%), Health & Fitness (12.39%) and Productivity (11.62%).
To wrap up past and present findings, here are the most important takeaways from these figures:
All in all, the most important lesson is this: know your user and app category. Motivations and user journeys vary so significantly between them that we should strive to know as much as possible about them to succeed. Also, seasonality matters for many categories.
Our real-time Apple Search Ads Benchmark Dashboard is the best way to track fluctuating metrics in day-to-day work.
Conversion rates reflect the likelihood of the user tapping the “GET” button after visiting your product page on the App Store (or, in some instances, directly after searching). The value of this metric can vary greatly between categories, as shown in the chart below:
The average conversion rate in 2023 was 65.37%, only a slight increase from 64.96% observed in H2 2022.
These figures are yet another example of how important it is to understand user behavioral patterns and intent for a given app category. Take Finance, the top category in CPT and CPA, but 14th for CR and outside the top 15 for TTR In 2023. It shows clearly that high user acquisition costs result from tough competition and reflect each category’s unique customer journey. While we may quickly install a “try for free” game (leading to high conversion rates for this category), it’s reasonable to assume that we must do more to gain the trust of people landing on our product page that our Finance app solves their problem. High CPT and CPA signal high potential for this category in terms of attainable user LTV (long-time value), but CR and TTR show just how much effort must be put into user acquisition.
The Entertainment category deserves a closer look because of its incredibly high (79.88%) average conversion rate, which can be attributed to some really powerful brands. A strong, recognizable brand brings in more traffic from branded keywords, which commonly have high conversion rates.
All these differences in customer journeys and category specifics show how important app store optimization strategy and brand promotion truly are.
For ASO, Mobile A/B testing with SplitMetrics Optimize is one of the most efficient and trustworthy ways to do it. App publishers can make the most of Apple Search Ads only by perfecting all store page elements. ASO is the foundation of all successful Apple Search Ads Campaigns. With high CPTs and CPAs, even a small TTR and CR uplift can have a financially significant impact.
Additionally, in 2024, multi-placement campaigns on the App Store show great potential to create brand awareness. Today tab ads, Search tab ads are visited by millions of users everyday. Utilizing them in Apple Search Ads campaigns can positively impact the performance of ads appearing in search results.
Cost per Acquisition (CPA) is the mobile app marketing metric that indicates how much you pay for every “GET” button tap.
The average cost per acquisition was $3.21 in the second half of 2022, a significant jump from $3.21 in the previous six months.
Finance topped the chart with a high but historically moderate $8.57 CTA (down from $11.34 in H2 2022). The next in line, the News category, reached $4.04. Sports landed third place with $3.73, with Business and Education closing the “above-the-average” podium with $2.93 and $2.77, respectively.
In the context of CPA, we need to discuss one last metric: Cost Per Installation (CPI). CPI isn’t a part of the core Apple Search Ads platform but functions in the SplitMetrics Acquire ecosystem.
In Apple Search Ads, installs are equated with downloads, or rather the instance of a user tapping the “GET” button, which doesn’t have to result in a physical installation of an app. Connectivity issues or other errors can interrupt the installation process and thus lead to data discrepancy. The “traditional” CPA doesn’t account for reinstalls from already acquired users or instances where the app wasn’t even opened after installation.
Our data shows that the number of app page visitors who tap “Get” differs from the number of visitors who eventually install the app. Therefore, the actual CPI can be higher than the CPA.
This is why, in our platform SplitMetrics Acquire, we allow customization of how installation is defined. In essence, it can be any in-app event that you think will best reflect the final step in the acquisition process. Installation can be counted when the user opens the app or even performs a specific action, like registering an account or launching certain features. We acquire this information thanks to our integration with various MMPs responsible for in-app behavior analytics.
In any case, for the purpose of our report, we used data from the App Store for consistency. Just remember what this official metric actually represents and that there are custom alternatives that can and will help you analyze acquisition costs in the context of your business goals. You can read more about optimizing your campaigns for installs in this whitepaper.
Should you decide that a customized approach to calculating CPI best reflects your business model and monetization plan, connect the app attribution system from your Mobile Measurement Partner (MMP, like AppsFlyer, Branch, Adjust, Kochava, TUNE, etc.) with SplitMetrics Acquire, an Apple Search Ads optimization platform, and see the App Store ads performance on all levels in one place. It can be a very simple process that doesn’t have to involve any additional IT resources. SplitMetrics is actively cooperating with various mobile measurement partners and their systems are prepared for a quick, integrated startup.
Is the average $2.58 Cost per Acquisition low or high? Given the large differences between categories, it makes more sense to assess CPA individually for each one of them.
App Store advertising cost is determined entirely by app publishers. Apple Search Ads functions on an auction basis, which means that the price you pay for a tap is the bid of your closest competitor + $0.01. The more competitors there are and the more aggressive their bidding is, the higher the Apple Search Ads price.
Analyze these benchmarks in relation to the return that can be generated with Apple Search Ads campaigns. Consider this: in Singular’s ROI Index 2024, Apple Search Ads is named as the top 3 mobile user acquisition network. It’s a platform dedicated to the App Store, reaching users with a high intent to download apps and guaranteeing high ROI.
Before joining a big auction and competing with other advertisers on Apple Search Ads, it might also be great to look at key factors that determine Apple Search Ads cost and learn how to adjust the CPT you’re getting to your mobile app marketing goals.
Know your audience, category, and competitors. The relevance score of Apple Search Ads ensures you compete only with relevant applications. These applications will likely be from your app’s category and weight class.
This way, Apple eliminates CPT bid peaks and provides conditions for fair competition for app publishers. Analyzing benchmarks for categories relevant to your app should definitely become a part of your mobile app marketing strategy, as it translates directly into your ability to predict and control Apple Search Ads pricing.